Dashboard
The Dashboard is a current view of the selected account. Use Refresh to reload its data and Export report to download the latest score report as a PDF.
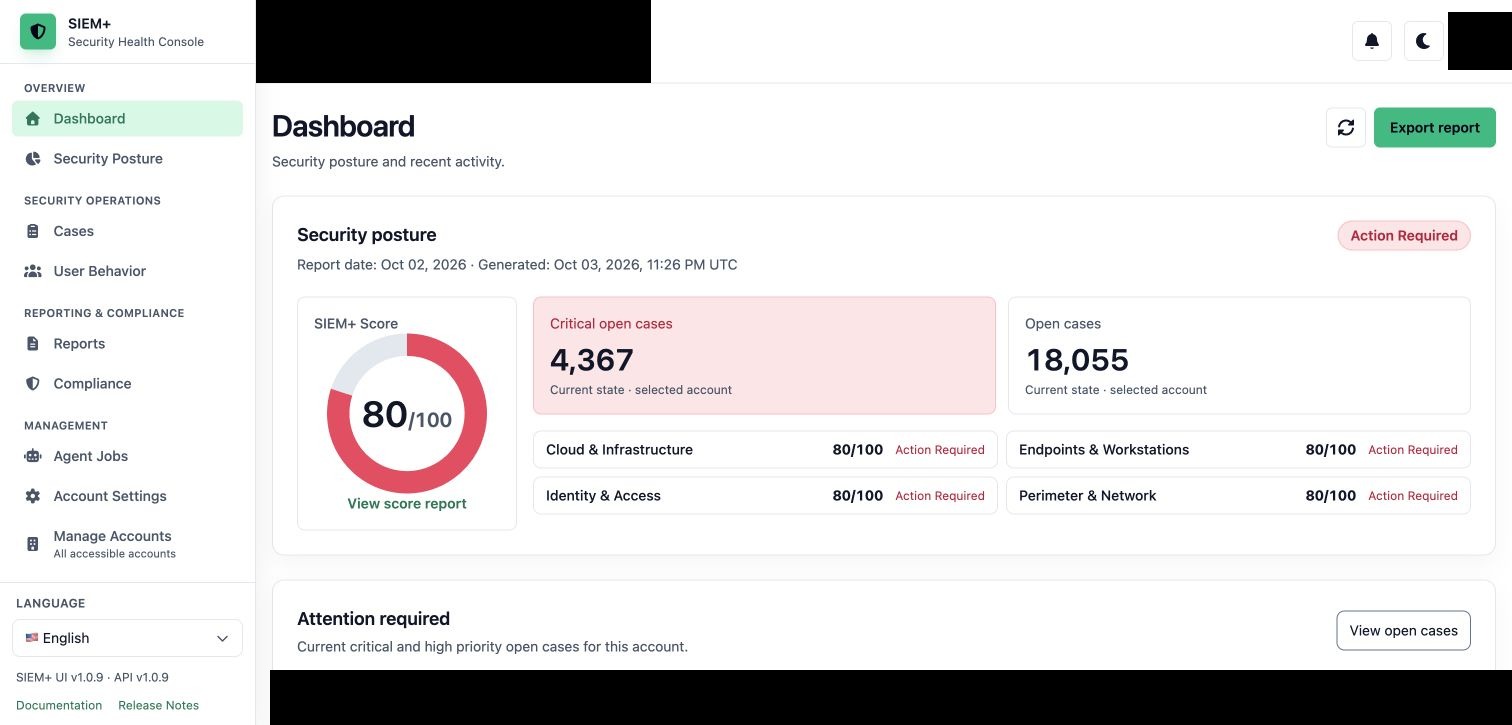
SIEM+ 1.0.9 Dashboard showing the Security posture and Attention required sections; account and personal identifiers are masked.
Dashboard cards
- Security posture shows the latest score and posture area scores, with current Critical open cases and Open cases counts.
- Attention required summarizes current high-priority and critical open cases.
- Seven-day activity shows Alerts received and Cases by report date. Today is incomplete, and case counts are grouped by report date rather than case creation time.
- Threat hunt summary shows the latest hunt results and coverage status.
- Recent open cases gives you a direct path to current investigation work.
Use Browse accounts in the header to choose another account; the selected account’s dashboard opens automatically. If a card has no data, check the selected account and the report or ingestion availability before treating it as an incident.
Export a score report
Select Export report to download the latest score report PDF for the selected account. SIEM+ may take a moment to prepare the file. If no score snapshot is available, ask an administrator to check the score-report agent and report history.
Step-by-step: review the dashboard
- Confirm the selected account in the header.
- Review the Security posture score and the current open-case counts.
- Review Attention required, Seven-day activity, and Threat hunt summary. Keep in mind that today’s case data is incomplete and grouped by report date.
- Select a case under Recent open cases when you need to continue an investigation.
- Select Export report when you need the latest score PDF, then wait for the download to finish.
- Select Refresh after scheduled ingestion or agent jobs have run and you need a newer snapshot.
Dashboard refresh
Dashboard data comes from the application API and can change as scheduled ingestion and automated jobs run. Select Refresh when you need the latest snapshot.